This chapter should be cited as follows:
DeVore GR, Glob Libr Women's Med
ISSN: 1756-2228; DOI 10.3843/GLOWM.419123
The Continuous Textbook of Women’s Medicine Series – Obstetrics Module
Volume 18
Ultrasound in obstetrics
Volume Editors:
Professor Caterina M (Katia) Bilardo, Amsterdam UMC, Amsterdam and University of Groningen, Groningen, The Netherlands
Dr Valentina Tsibizova, PREIS International School, Florence, Italy
Chapter
Second- and Third-Trimester Screening for Congenital Heart Defects: A Practical Approach
First published: October 2024
Study Assessment Option
By answering four multiple-choice questions (randomly selected) after studying this chapter, readers can qualify for Continuing Professional Development points plus a Study Completion Certificate from GLOWM.
See end of chapter for details.

INTRODUCTION
Congenital heart disease (CHD) is the most common malformation (10/1000 to 16.5/1000),1 with a risk surpassing that of trisomy 21 (1.6/1000)2 and neural tube defects (0.71 to 0.94/1000).3 However, for the past 40 years, the emphasis on prenatal detection has been on detecting trisomies 21, 13 and 18 as well as neural tube defects using various combinations of ultrasound and blood tests to screen for these malformations. During the evolution of aneuploidy screening, the detection of CHD evolved, but at a slower pace. For example, the first reports that abnormalities of the four-chamber view (4CV) were associated with a number of congenital heart defects appeared in 19854 and 1987.5 Following the observation that alterations in the size and shape of the ventricles and/or atria in the 4CV identified fetuses at risk for CHD, a study in 1992 reported how to image the outflow tracts during a screening examination of the fetal heart.6 After more than 30 years, the screening examination of the fetal heart is now the standard of care when performing a second- or third-trimester ultrasound examination of the fetal heart.6,7 While first-trimester screening for CHD has been suggested by some investigators, screening during this time of pregnancy has not been universally implemented.8,9 Therefore, the purpose of this chapter is to provide a practical approach for optimal screening of the fetal heart during the second and third trimesters of pregnancy.
SCREENING GUIDELINES
The most recent screening guidelines from the International Society of Ultrasound in Obstetrics and Gynecology (ISUOG) for evaluating the fetal heart recommend a transverse sweep through the upper abdomen and chest, which identifies the fetal stomach, 4CV, left ventricular outflow tract (LVOT), right ventricular outflow tract (RVOT), and the three-vessel-and-trachea view (3VTV) (Figure 1, Video 1).10

1
Transverse sweep through the upper abdomen and chest recommended for the screening examination of the fetal heart. (A) Level of the fetal stomach demonstrating the stomach to be on the left side of the abdomen. (B) Four-chamber view. (C) Left ventricular outflow tract (LVOT). (D) Right ventricular outflow tract (RVOT) at the level of the three-vessel view (3VV). (E) Three-vessel view at the level trachea (3V TV).
1
Screening sweep from the abdomen to the upper chest with the fetus in the vertex position.
DETERMINATION OF SITUS
Video 2 illustrates the following steps to identify fetal situs.
- Place the patient so that structures on the examiner’s right are seen on the right side of the screen and those on the examiner’s left are on the left side of the screen.
- Next, lift the edge of the right side of the transducer off the maternal abdomen to see if the corresponding shadow is on the right side of the screen. If it is not, rotate the transducer 180° or flip the image on the screen using the relevant key on the machine.
- Once this is done, identify the fetal head to determine if the fetus is vertex, transverse or breech.
- Then, sweep the transducer beam through the fetal trunk to identify the position of the stomach and 4CV to ascertain that they are on the left side of the fetal body.
2
Identification of fetal situs.
ORIENTATION OF THE FOUR-CHAMBER VIEW WITHIN THE FETAL CHEST
Once situs has been determined, the next step is to identify the position of the fetal heart within the chest. The angle should be 45° (range 25–65°).11 Cardiac malformations have been associated with both right and left axis deviation of the 4CV.11,12 Video 3 illustrates how this is accomplished using the following steps.
- Freeze the 4CV image on the screen and do the following:
- Identify the edge of the ribs on the right and left sides of the chest and draw a line connecting the ends of the ribs (Figure 2A).The length of the line is divided by two to determine the mid-position.
- Draw a second line to the mid-point of the first line (Figure 2B).
- Draw a line from the spine to the end of the second line. This identifies the mid-point of the chest (Figure 2C).
- Using the angle tool, draw a fourth line along the interventricular septum. This computes the angle between the septum and the midline drawn through the chest (Figure 2D).
- Another approach is to use an automated method available on several of the commercially available systems that automatically measure the axis and provide a color code of the normal axis (green), outside of which would be considered abnormal (red) (Figure 3).
3
Measuring the axis of the heart.

2
Measuring the axis of the four-chamber view. (A) Step 1. Measure the distance between the anterior ribs which is 5.41 cm. (B) Step 2. A line is drawn half the distance from the first line to identify the mid-position of the anterior chest wall. (C) Step 3. A line is drawn from the center of the spine to the mid-position of the anterior chest wall. (D) Step 4. Using the angle feature on the ultrasound measurement package, the angle is measured between the line in Step 3 and the interventricular septum. In this example, the angle is 50.41°.

3
Automated axis measurement. This is from an ultrasound machine that automatically computes the angle of the four-chamber view in the chest. The green represents the normal range and the red the abnormal range for the axis of the heart. Card-Ax, cardiac axis.
MEASUREMENT OF THE SIZE OF THE FOUR-CHAMBER VIEW
The cardiothoracic ratio is a surrogate for assessing the size of the fetal heart. In 2021, Sompagdee et al. provided normal reference interval values (5th, 10th, 50th, 90th, 95th) for the cardiothoracic ratio measured with diameters (Video 4), area and circumference using gestational age and the biparietal diameter as independent variables (Figure 4).13 In the ISUOG fetal cardiac screening guidelines, the size of the 4CV is only inferred in a table which states that the heart should occupy one-third of thoracic area.10 ISUOG’s guideline on the performance of third-trimester obstetric scan states that the normal cardiothoracic circumference ratio in the third trimester is approximately 0.45 and should be no greater than 0.5 (Figure 5).10,14 ,15 16Neither guideline provides a reference for quantifying the 5th or 95th percentiles when measuring the cardiothoracic ratio nor is it acknowledged that the cardiothoracic ratio assumes that the chest is of normal size. In practice, it is preferable to measure directly the end-diastolic size of the 4CV and not assume its size is increased or decreased based upon its ratio to the size of the chest. Evaluation of the size of the 4CV can be accomplished using one of several measuring tools available on most ultrasound machines and correlating the size of the heart with biometric measurements such as the biparietal diameter, head circumference, abdominal circumference, femur length or estimated fetal weight, as well as gestational age.
4
Measurement of heart-to-chest ratio.

4
Cardiothoracic ratios plotted with data from Sompagdee et al.13 using the diameter, circumference and area measurements of the four-chamber view and the chest.

5
Assessment of cardiomegaly. (A) Measurement of the heart-to-chest area ratio recommended by ISUOG for the screening examination10 and the heart-to-chest circumference ratio recommended by ISUOG for the third-trimester examination.14 (B) Direct measurement of the length, width, circumference and area of the four-chamber view from an ultrasound machine that computes the z-score and z-score percentile for each measurement. 4CV, four-chamber view; A, area; AUA, ultrasound age; C, circumference; ED, end-diastole; GSI; global sphericity index; L, length; LA, left atrium; LV, left ventricle; RA, right atrium; RV, right ventricle; ZS, z-score; TW, transverse width. (Reproduced with permission.15)
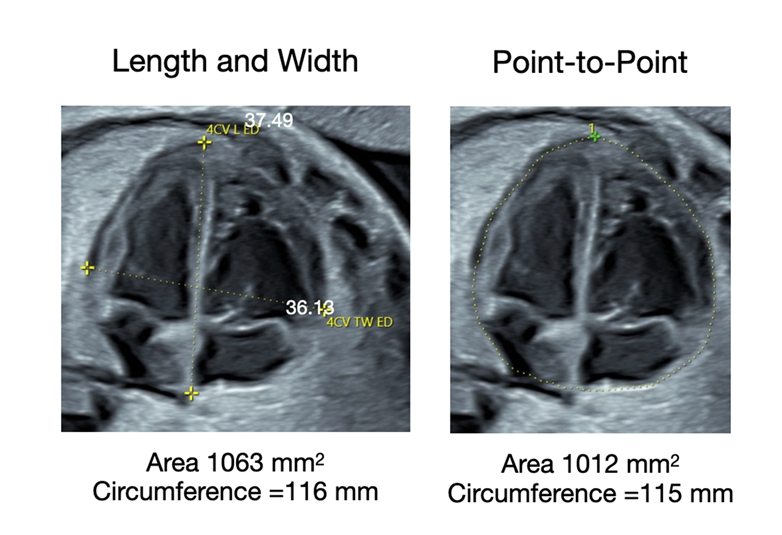
The tools for measuring the area and circumference are as follows: (1) two-diameter method in which the longest length. and widest width of the four-chamber view are measured (Figure 6A),17 (2) the point-to-point method, which requires a manual trace (Figure 6B), and (3) the ellipse method, which uses electronic calipers (Figure 6C).18 Recent publications have provided calculators to compute the z-score of the end-diastolic size of the 4CV,17,18 and Supplement 1 – Heart Size provides a calculator that computes the size of the 4CV using the three methods listed in Figure 6 using the estimated fetal weight as the independent variable.

6
Ultrasound measurement tools available on ultrasound machines to measure the area of the four-chamber view. (A) Length and width measurement from which the area is computed. (B) Point-to-point trace which provides direct measurement of the area. (C) Ellipse method which does not always identify the epicardium (arrows).
| Enter Measurements in the Yellow Cells | Clear Cells |
|||||||||||||||
| EFW (grams) |
|
|||||||||||||||
| END-DIASTOLIC MEASUREMENTS | Z-Score | Z-Score Percentile | Mean | Sd | ||||||||||||
| WIDTH (mm) | ||||||||||||||||
| LENGTH (mm) | ||||||||||||||||
| END-DIASTOLIC AREA (mm2) | Z-Score | Z-Score Percentile | Mean | Sd | ||||||||||||
| Point-to-Point Trace | ||||||||||||||||
| Ellipse | ||||||||||||||||
| Length and Width | ||||||||||||||||
| END-DIASTOLIC CIRCUMFERENCE (mm) | Z-Score | Z-Score Percentile | Mean | Sd | ||||||||||||
| Point-to-Point Trace | ||||||||||||||||
| Ellipse | ||||||||||||||||
| Length and Width | ||||||||||||||||
Enter the data in the yellow cells. The width, length and circumference are in millimeters (mm) and the area is in millimeters squared (mm2). |
||||||||||||||||
|
|
||||||||||||||||
|
DeVore GR, Satou G, Sklansky M. Area of the fetal heart's four-chamber view: a practical screening tool to improve detection of cardiac abnormalities in a low-risk population. Prenat Diagn 2017;37(2):151-155. DeVore GR, Tabsh K, Polanco B, Satou G, Sklansky M. Fetal Heart Size: A Comparison Between the Point-to-Point Trace and Automated Ellipse Methods Between 20 and 40 Weeks' Gestation. J Ultrasound Med 2016;35(12):2543-2562. |
||||||||||||||||
1
Heart size calculator.
GESTATIONAL AGE AFFECTS IMAGE QUALITY
Figure 7 and Video 5 illustrate 4CV clips at gestational ages of 16, 20, 24, 28, 32, 34 and 36 weeks, demonstrating how the clarity of the structures of the 4CV improves with gestational age. While the screening examination is usually performed between 18 and 22 weeks, a later gestational age may be required in obese patients.19

7
Resolution of the four-chamber view as a function of gestational age. As the fetal age increases, the resolution of the four-chamber view improves, providing greater detail of its anatomical features.
5
Improved image resolution with advancing gestational age.
ANATOMY OF THE LEFT VENTRICLE
The left ventricle (LV) lies within the left side of chest, beneath the right ventricle (RV). It is shaped like a bullet (Figure 8A, Video 6), with a clearly defined apex. If the end-diastolic image of the 4CV contains the inferior papillary muscle, the plane of the 4CV would not be accurately imaged (Figure 8B). The septal leaflet of the mitral valve inserts higher on the interventricular septum than does the tricuspid valve (Figure 8C).The mid-portion of the LV should demonstrate movement of the interventricular septum towards the center of the chamber. Figure 9 illustrates movement of the ventricular and septal walls using speckle tracking. In the normal fetus the left side of the ventricular septum moves inwards towards the chamber, while the right side of the septum has no or little movement (Figure 9, Video 7). Visual inspection of the lateral wall thickness of the LV should be similar to that of the RV.

8
Anatomy of the left ventricle. (A) This illustrates the bullet shape of the left ventricle. (B) Papillary muscle observed at end-systole that should not be confused with the lateral wall as outlined by the red line. (C) Insertion of the mitral valve leaflets into the ventricular septum and the lateral wall. The mitral valve insertion into the septal wall occurs after the angle of the septum, as represented by the yellow line.
6
Normal four-chamber view

9
Movement of the ventricular septum during systole. (A) Graphic of wall and septal movement during systole. In the normal fetus the interventricular septum moves inward, towards the center of the left ventricular cavity, while the septum of the right ventricle demonstrates minimal movement. (B,D) Location of the speckle-tracking points (yellow dots) at end-diastole. (C,E) Movement of the speckle-tracking points during systole. There is movement along the left septal wall but little or no movement along the right septal wall. ED, end-diastolic; ES, end-systolic.
7
Speckle tracking of the endocardium.
ANATOMY OF THE RIGHT VENTRICLE
The right ventricle is more globular in shape, with the apex being “blunted” (Figure 10A, Video 6). A band can also be observed running from the apex to the valve insertion, located in the center of the chamber (Figure 10B). During ventricular systole, the interventricular septum does not move towards the center of the RV as it does to the center of the LV (Figure 9, Video 7). The tricuspid valve inserts on the septal wall lower than the mitral valve and is opposite the “bend” of the septum at this level, as illustrated by the yellow line in Figure 10B. The moderator band, which is located between the septal and lateral apical walls of the RV, often obliterates the apex in systole (Figure 10C, Video 6). Visual inspection of the lateral wall thickness of the RV should be similar to that of the LV.

10
Anatomy of the right ventricle (RV). (A) The shape of the right ventricle (RV) is triangular. (B) In the middle of the RV is a central papillary band that inserts into the tricuspid valve leaflet from the apex of the chamber. (C) Moderator band located at the apex of the RV chamber. Ao, thoracic aorta.
ANATOMY OF THE INTERVENTRICULAR SEPTUM
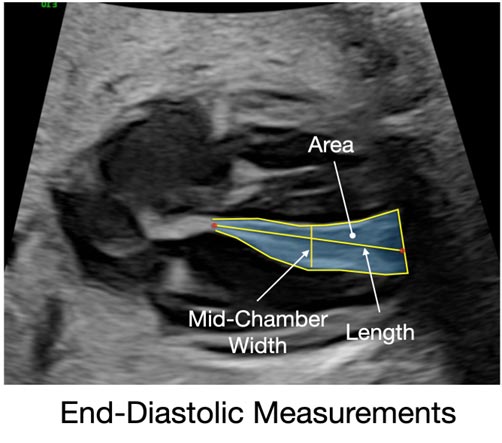
The interventricular septum is triangular, with the apex forming at the insertion of the tricuspid and mitral valves into the septum. As mentioned above, the septal wall of the LV moves towards the center of the chamber while the septal wall of the RV has minimal or no movement towards the center of the RV chamber (Video 7). Since the ventricular septum is triangular, measurement of its width is fraught with error, since it tapers from the base to the apex of the septum. Recently, a study was published in which the septal area was measured at both end-diastole and end-systole and found no difference between the two areas (Figure 11).20 A calculator is provided that computes the z-score of the septal thickness (Supplement 2 – Septal Calculator).20

11
Measurement of the interventricular septum. The image of the four-chamber view illustrates the 3 septal measurements, area, mid-chamber width, and the length. The above graphs illustrate the end-systolic and end-diastolic areas for six independent variables. There is no difference whether the septal area is measured at end-systole or end-diastole. (Reproduced with permission.20)
| Enter Measurements in the Yellow Cells | Clear Cells |
|||||
| Gestational Age (Weeks) | BPD (cm) | |||||
| HC (cm) | AC (cm) | |||||
| FL (cm) | EFW (grams) | |||||
| End-Diastolic Area (cm 2) |
End-Systolic Area (cm 2) | End-Diastolic Mid-Chamber Width (mm) | End-Diastolic Length (mm) | |||
| GA Z-Score | ||||||
| GA Centile | ||||||
| BPD Z-Score | ||||||
| BPD Centile | ||||||
| HC Z-Score | ||||||
| HC Centile | ||||||
| AC Z-Score | ||||||
| AC Centile | ||||||
| FL Z-Score | ||||||
| FL Centile | ||||||
| EFW Z-Score | ||||||
| EFW Centile | ||||||
| End-Diastolic Width/Length Ratio for the Mid-Chamber Width | ||||||
| Z-Score | Centile | |||||
 |
||||||
2
Septal calculator.
ANATOMY OF THE LEFT ATRIUM
Of the atrial chambers, the left atrium (LA) is the most important for identifying CHDs. The LA is shaped like a sausage and has three important anatomical features that should be identified during the screening examination (Figure 12, Video 6). The first is identification of two pulmonary veins entering the LA (Figure 12A). One vein enters near the atrial septum and the second vein enters near the back lateral wall of the atrial chamber. The second is identification of the integrity of the interventricular septum with the atrial septum to exclude an ostium primum defect (Figure 12B). The third is identification of the foramen ovale in which blood flows from the right atrium (RA) to the LA (Figure 12C) as demonstrated by the foramen ovale within the left atrial chamber during the cardiac cycle (Figure 12C).

12
Left atrial anatomy. (A) Location of the two pulmonary veins entering the back wall of the left atrial chamber and the distance between the aorta and the back wall of the chamber. (B) Globular shape of the right atrium (RA) and the elongated shape of the left atrium (LA) as well as the location of the ostium primum. (C) Location of the foramen ovale (FO) and the flap of the FO in the left atrial chamber.
ANATOMY OF THE RIGHT ATRIUM
The right atrial chamber is globular in shape (Figure 12, Video 6). In the 4CV there are no major anatomical landmarks except occasionally a flap of the Eustachian valve can be observed near the back wall of the atrial septum. In a study of the size, shape and contractility of the atrial chambers, it was reported that, although the atrial chambers are of different shapes, their end-diastolic areas were similar (Figure 13).

13
End-diastolic area of the atrial chambers. (A) Left atrial (LA) area. (B) Right atrial (RA) area. (C) LA and RA end-diastolic areas superimposed demonstrating no significant difference between them. LV, left ventricle; RV, right ventricle. (Reproduced with permission.21 )
IDENTIFICATION OF THE OUTFLOW TRACTS
To exclude structural malformations of the aorta and pulmonary artery, there are three principles that should be considered. (1) As the aorta and main pulmonary artery immediately exit their respective ventricles, they should be perpendicular to one another; (2) the main pulmonary artery should demonstrate bifurcation into the right and the left pulmonary arteries and (3) the aorta should demonstrate continuity between the ascending aorta, the aortic arch and descending aorta. Using the current screening protocol illustrated in the ISUOG guidelines,10 only two of the three criteria are met.
Criterion 1. The perpendicular relationship of the ascending aorta and main pulmonary is identified from the three-vessel view in which the long axis of the main pulmonary artery is perpendicular to the short axis of the aorta (Figure 1D, Video 1).10
Criterion 2. The branching of the right and left pulmonary arteries exiting the main pulmonary artery is identified in the RVOT three-vessel view (Figure 1D, Video 1).
Criterion 3. Although a portion of the transverse aortic arch is visualized at the level of the tracheal view, the aortic arch is not completely visualized nor the descending aorta, therefore precluding the exclusion of an interrupted aortic arch (Figure 1C,E, Video 1).
To resolve the imaging deficiency listed under Criterion 3, there are two approaches using two of the four screening views of the heart proposed in the ISUOG screening guidelines as the reference point for rotation of the transducer to identify the continuity between the ascending aorta, aortic arch and the descending aorta.
Option 1. Identification of the continuity between ascending aorta, aortic rch and descending aorta using the left outflow tract view as the reference point for rotation of the transducer
In 1992, I described a technique to image the continuity between the ascending aorta, the aortic arch and the descending aorta, as well as demonstrated the ascending aorta and main pulmonary arteries to be perpendicular to each other as they exit their respective ventricles.6 The description of this technique was incomplete in the ISUOG guidelines. Therefore, I would like to suggest the following approach.
In the study described in 1992,6 the 4CV was imaged with the interventricular septum perpendicular to the ultrasound beam (Figure 14A). After imaging the 4CV, the transducer beam is directed cephalad, in a transverse plane, to identify the outflow tract as it exits the LV (Figure 14B). Once the left outflow tract is identified exiting the ventricle, the transducer is rotated 45° which confirms the integrity of the ascending aorta, aortic arch and a portion of the descending aorta (Figure 14C). Once the aortic arch is identified, the transducer is rocked towards the fetal head to identify the main pulmonary artery perpendicular to the ascending aorta as it exits the RV (Figure 14D).

14
Rotation from the left ventricular outflow tract view to image the aortic arch. (A) Four-chamber view imaged when the interventricular septum is perpendicular to the ultrasound beam. (B) Left ventricular outflow tract (LVOT) view. (C) After rotation of the transducer by 45°, using the LVOT view as the reference image, the aortic arch is identified. (D) By rocking the transducer towards the fetal head, the main pulmonary artery is imaged, perpendicular to the ascending aorta as both outflow tracts exit their respective ventricles. LA, left atrium; LV, left ventricle; RA, right atrium; RV, right ventricle. (Reproduced with permission.15)
Option 2. Identification of the continuity between ascending aorta, aortic arch and descending aorta using the three-vessel-and-trachea view reference for rotation of the transducer
Once the 4CV is identified when the interventricular septum is perpendicular to the ultrasound beam (Figure 15A), the screening examination outlined in the ISUOG guidelines describes directing the ultrasound beam cephalad, in a transverse plane, to identify the 3VTV which demonstrates convergence of the ductus arteriosus with the transverse aortic arch. In this view, the transverse arch is parallel to the ultrasound beam (Figure 15B). By rotating the transducer 90°, the aortic arch can be identified (Figure 15C).

15
Identification of the aortic arch by rotation of the transducer 90° from the three-vessel-and-trachea view. (A) Four-chamber view, with interventricular septum perpendicular to the ultrasound beam. (B) Three-vessel-and-trachea view, in which the transverse arch (TAA) is parallel to the ultrasound beam (yellow line). To image the aorta (C), the transducer is rotated 90° along the axis of the transverse arch. DA, ductus arteriosus; IVC, inferior vena cava; LA, left atrium; LV, left ventricle; RA, right atrium; RV, right ventricle; SVC, superior vena cava; T, trachea. (Reproduced with permission15)
ROLE OF COLOR AND POWER DOPPLER
Color and power Doppler (C/PD) ultrasound are different imaging modalities that identify blood flow in the vessels and the heart. The advantages of C/PD during the screening examination are as follows: (1) identification of shunting ventricular defects not identified with 2D ultrasound because of the grayscale properties of lateral resolution (Figure 16, Video 8), and (2) identification of tricuspid or mitral regurgitation (Figure 17, Video 9), as well as abnormal flow imaged in the 3VTV which can demonstrate aortic or pulmonary stenosis with reversed flow of the compromised outflow tract from the ductus arteriosus (Figure 18, Video 10).

16
Ventricular septal defect (VSD) identified with color Doppler ultrasound. (A) Four-chamber view side-by-side image of the grayscale on the left in which a VSD is not observed (circle) because of lateral resolution of the ultrasound beam and the color Doppler image that demonstrates a shunting VSD (circle). (B) the same findings at the level of the left outflow tract. Ao, aortic valve; LA, left atrium; LV, left ventricle; RA, right atrium; RV, right ventricle.
8
Shunting ventricular septal defect identified only with color Doppler ultrasound.

17
(A) Tricuspid valve stenosis (TV S). (B) Color Doppler demonstrating tricuspid regurgitation (TR) during ventricular systole. LA, left atrium; LV, left ventricle; RA, right atrium; RV, right ventricle.
9
Tricuspid regurgitation.

18
Three-vessel-and-trachea view demonstrating bidirectional flow in the main pulmonary artery and ductus arteriosus. (A) The red color illustrates flow from the transverse arch retrograde filling the ductus arteriosus and main pulmonary artery. (B) Pulmonary regurgitation back into the right ventricle.
10
Reversed flow in main pulmonary artery.
EVALUATION OF FETAL HEART RATE
When an irregular heart rate occurs during the screening examination, the type of rhythm disturbance must be identified. While both pulsed Doppler and M-mode ultrasound have been used to identify the type of rhythm disturbance, the easiest method is M-mode ultrasound.
- Assessment of the atrial rate. This is accomplished by placing the M-mode cursor perpendicular to the atrial wall. This will identify premature beats, premature beats with block, bradycardia and tachycardia (Figure 19A).
- Assessment of atrioventricular rate. The easiest method is to place the M-mode line through the atrial wall and ventricular wall or the M-mode line through the atrial wall and the aortic valve using color Doppler ultrasound imaged in the left outflow tract (Figure 19B,C). Clues to determine the nature of the arrhythmia can also be assessed by examining the real-time image. Video 11 illustrates premature atrial contractions, paroxysmal atrial tachycardia and heart block.

19
Identification of the fetal heart rate. (A) To evaluate atrial contraction the M-mode cursor is placed perpendicular to the atrial septum. (B) When evaluating the relationship between atrial and ventricular contractions, the M-mode cursor is directed through the atrial wall (yellow star) and ventricular wall (pink star). (C) M-mode with color Doppler. The M-mode is directed through the aortic valve and the posterior atrial wall. Atrial systole is identified from the grayscale M-mode movement (yellow star) and the blood flow using color Doppler (pink star) through the aortic valve.
11
Fetal arrhythmia.
IDENTIFICATION AND SIGNIFICANCE OF A PERICARDIAL EFFUSION
The ISUOG guidelines state the following regarding a pericardial effusion, “A small amount of pericardial fluid is commonly seen during the second and third trimesters (≤2 mm in thickness, at end-systole) and is a normal finding. Some views may also reveal a small hypoechogenic rim around the fetal heart, and care should be taken not to mistake this for a pericardial effusion.”10 The above statement is not entirely correct and requires further elaboration so those performing a screening examination of the heart understand the evolution of a pericardial effusion and its significance. Identification of a pericardial effusion has the following characteristics compared to a hypoechogenic rim:
- A hypoechogenic rim or echo dropout often is present and may be confused with a pericardial effusion. However, if the pericardium, pericardial fluid, epicardium, and full thickness of the myocardium are identified, then the “hypoechogenic rim” can be differentiated from a pericardial effusion.
- Identification of the full thickness of the myocardium is essential because the hypoechogenic rim is part of the myocardium and results from the curvature of the muscle fibers of the myocardium in which echoes are not reflected to the transducer, resulting in a black area which can be confused with a pericardial effusion which is external to the myocardium.
Figure 20 illustrates the simultaneous presence of a pericardial effusion along the right ventricular wall and a hypoechogenic rim in the left ventricular wall. To separate the hypoechogenic rim from an effusion, color or power Doppler can be used (Figure 21).

20
Identification of pericardial effusion and hypoechogenic rim. (A) Grayscale image of four-chamber view demonstrating a pericardial effusion along the right ventricular wall and a hypoechogenic rim within the left ventricular wall. (B) Color overlay identifying the pericardial effusion in green, hypoechogenic rim in red, and normal fluid at the atrioventricular junction in yellow. LA, left atrium; LV, left ventricle; RA, right atrium; RV, right ventricle. (Reproduced with permission15)

21
Identification of pericardial effusion using color Doppler ultrasound. (A) Two-dimensional grayscale image of four-chamber view, demonstrating a right-sided pericardial effusion. (B) Demonstration of movement of pericardial fluid within the pericardial space during ventricular diastole. The color identification of pericardial fluid is always opposite in color to that of the blood flow within the ventricular chamber. LA, left atrium; LV, left ventricle; RA, right atrium; RV, right ventricle. (Reproduced with permission15)
Pericardial fluid is commonly observed at the atrioventricular (AV) junction in systole for both the RV and LV and is a normal finding. However, it should not extend along the right or left ventricular walls during systole or diastole (Figures 20 and 21). A pericardial effusion, when present, occurs almost exclusively along the RV wall and not the LV unless hydrops is present or there is LV pathology. A pericardial effusion evolves through the following stages:
- The pericardium and epicardium separate during systole, beginning at the AV junction and dissects towards the apex of the ventricle.
- As the pericardial effusion increases in size, it is present both during systole and diastole.
A pericardial effusion in the second trimester is associated with aneuploidy as well as increased risk for fetal anemia and viral infections.22,23
The 2-mm rule is misleading and has been promulgated from a study published in the 1990s in which the authors thought the hypoechogenic rim was a pericardial effusion.24 In a study identifying ultrasound markers for trisomy 21, a pericardial effusion was detected in 19% of fetuses with trisomy 21 and in only 2.4% of 2000 controls.22 Therefore, in the second trimester, a pericardial effusion is not common, and if present, indicates an increased relative risk (10.02 (95% CI, 3.82–26.29)) for trisomy 21.23
A pericardial effusion observed in the third trimester is often associated with placental dysfunction as manifest as a decreased abdominal circumference <10th centile, fetal growth restriction, and/or oligohydramnios. In addition, a pericardial effusion may be one of the first signs of fetal anemia. In my experience, a pericardial effusion of any size has clinical significance in both the second and third trimesters of pregnancy when defined by the above anatomical criteria and should not be confused with hypoechogenic dropout of the myocardium.
CLUES TO ASSIST THE EXAMINER TO IDENTIFY FETUSES WITH CONGENITAL HEART DEFECTS
The non-cardiologist who performs a screening examination is not expected to provide the final diagnosis of a CHD but to identify changes in the screening examination anatomy that would suggest a cardiac defect is present. Following detection of abnormality in the screening views, the patient should be referred to a specialist who can perform fetal echocardiography and counsel the patient regarding the diagnosis and outcome of the detected anomaly. The screener should consider asking the following questions:
- Is the heart axis in the 4CV normal or shifted to the right or left? An abnormal axis has been associated with conotruncal malformations, and lung malformations such as a sequestered lung or cystic adenomatoid malformation, as well as right- and left-sided diaphragmatic hernias (Figure 22).

22
Abnormal cardiac axis (<25° or >65°), as defined by the ISUOG guideline.10 (A) Fetus with D-transposition. (B) Fetus with tetralogy of Fallot. (C) Fetus with an endocardial cushion defect.
- Is the size of the heart in the 4CV increased in area or width? Previous work has shown that the increased size of the 4CV is associated with CHDs (Figure 23) as well as other maternal and fetal diseases (Table 1).17,25

23
Cardiomegaly demonstrating that the end-diastolic width, length, area and circumference are increased in size as manifest by the z-score values and corresponding z-score percentiles.
1
Fetal conditions associated with cardiomegaly. Adapted from DeVore et al.18
Affected structure/condition
Abnormality
Four-chamber view
Ventricles
Aneurysm
Tricuspid valve
Tricuspid valve regurgitation
Ebstein malformation
Tricuspid valve dysplasia
Tricuspid valve atresia
Mitral valve
Mitral valve regurgitation
Mitral valve atresia
Cardiomyopathy
Myocardial dysplasia or non-compaction
Unspecified
Outflow tracts
Aortic valve
Absent aortic valve
Critical aortic stenosis
Pulmonary valve
Pulmonary valve hypoplasia/atresia
Pulmonary valve regurgitation
Heart rate
Arrhythmia
Congenital heart block
Peripheral vessels
Ductus venosus
Agenesis
Vein of Galen
Aneurysm
Umbilical vein
Aberrant
Varix
Arteriovenous fistula
Intracranial
Pulmonary
Other fetal/placental problem
Fetal anemia
Parvovirus
Bart’s hemoglobinopathy
Viral infection
Cytomegalovirus
Placenta
Chorioangioma
Liver
Hemangioendothelioma
Thyroid
Goiter
Spine
Sacrococcygeal teratoma
Lymphatic system
Lymphangioma
Connective tissue
Marfan syndrome
Mucopolysaccharidosis
Type II (Hunter syndrome)
Abdomen
Ascites
Chromosomes
Trisomy
Tetrasomy
Fetal drug exposure
Indomethacin
- Are the atrial chambers of similar size and are the ventricular chambers of similar size or is there disproportion with one chamber appearing to be larger than the other? Disproportion is one of the most common findings in fetuses with hypoplastic RV and LV, and coarctation of the aorta, as well as in fetuses with growth restriction (Figure 24).

24
Chamber disproportion. (A) This is a fetus with a hypoplastic left ventricle (LV) demonstrating significant disproportion between the right ventricle (RV) and LV and the right atrium (RA) and left atrium (LA). (B) This fetus had a hypoplastic RV as the result of severe tricuspid stenosis. While there is significant disproportion between the ventricular chambers, the atrial chambers are equal in size.
- Do the right and left ventricular wall thicknesses appear to be increased or disproportionate in width? If one ventricular wall is thicker than the other ventricular wall, then the examiner has to consider that there may be outflow tract stenosis or increased resistance resulting in hypertrophy of the affected ventricular chamber (Figure 24B). Enlargement of both ventricular walls has been observed in fetuses with growth restriction and cardiomyopathy.
- Is the ventricular septum normal size or does it appear to be enlarged? An enlarged ventricular septum has been associated with maternal diabetes and fetal macrosomia as well as structural malformations and fetal growth restriction (Figure 25). A simple method to determine the size of the ventricular septum is to measure the end-diastolic or end-systolic area as described in this chapter using the calculator (Supplement 2 – Septal Calculator).

25
Septal hypertrophy in a fetus with growth restriction. (A) This illustrates the mid-chamber transverse width at the 40th percentile and the length at the 99th percentile. (B) Enlarged end-diastolic measurement of the ventricular septum.
- Does the ventricular septum appear to be intact? When examining the septum for defects, the best orientation is when the septum is at 45° to the ultrasound beam because it maximizes axial and lateral resolution. If the septum is parallel to the ultrasound beam, artifactual dropout may occur suggesting a ventricular septal defect which may not be present and is the result of echo dropout. If the septum is perpendicular or tangential to the ultrasound beam, then because of lateral resolution, the septal defect may not be identified (Figure 26A,B, Video 12). In this situation, color Doppler will demonstrate shunting of blood across the septum (Figure 26C).

26
Shunting ventricular septal defect (VSD). (A) Grayscale image with the septum perpendicular to the ultrasound beam. The VSD is not observed in this plane because of the imaging properties of lateral resolution. (B) Grayscale image with the septum using the combination of axial and lateral resolution which does not demonstrate the VSD. (C) Color Doppler demonstrating a VSD with blood shunting from the LV to the RV.
12
Shunting ventricular septal defect observed only with color Doppler ultrasound (different case from that in Video 8).
- Do the mitral and tricuspid valves appear to open normally and have equal excursion during ventricular diastole? When the ventricular or atrial chambers appear to be disproportionate, then the examiner should evaluate the size of the mitral and tricuspid valve openings. This can be done from the real-time image or the M-mode recording directed perpendicular to the septum (Figure 27A,B).

27
Abnormal atrioventricular valve in a fetus with an endocardial cushion defect. (A) Normal four-chamber view demonstrating opening of the tricuspid and mitral valve leaflets (arrows) during ventricular diastole. (B) Corresponding M-mode tracing at the level of the atrioventricular valves during diastole and the interventricular septum separating the tricuspid (red) and mitral valve (green) leaflets. (C) Four-chamber view demonstrating an endocardial cushion defect consisting of a ventricular and ostium primum septal defect. (D) The M-mode demonstrates a single atrioventricular valve (blue) opening and closing. ASD, atrial septal defect; AV, atrioventricular valve; LA, left atrium; LV, left ventricle; LVW, left ventricular wall; MV, mitral valve; RA, right atrium; RV, right ventricle; RVW, right ventricular wall; TV, tricuspid valve; VSD, ventricular septal defect.
- Does the insertion of the septal leaflets appear to be offset, with the tricuspid valve inserting lower, towards the apex, than the mitral valve? Absence of the offset has been associated with trisomy 21 and endocardial cushion defect as well as Ebstein’s anomaly (Figure 27C,D, Video 13).
13
Endocardial cushion defect.
- Does the foramen ovale flap move within the left atrial chamber normally or is there minimal excursion from the interatrial septum? Abnormal movement of the foramen ovale valve has been recognized with coarctation of the aorta, as well as hypoplastic left ventricle (Figure 28).

28
Ventricular and atrial disproportion in a fetus with coarctation of the aorta. The left ventricle (LV) and left atrium (LA) are smaller than the right ventricle (RV) and right atrium (RA).
- Is one or both pulmonary veins observed entering the left atrium? If at least one pulmonary vein is observed, then the examiner can exclude complete anomalous pulmonary venous return (Figure 12).
- While the 4CV may appear to be normal, (Figure 29A, Video 14) the question should be asked 'Does the size of the aorta at the level of the left outflow tract view appear to be increased in size or does it straddle the interventricular septum?' While a septal defect associated with tetralogy of Fallot, double outlet RV or LV, or truncus arteriosus may not be easily identified during the screening examination, an enlarged aorta is a clue that one of these anomalies may be present (Figure 29B,C, Video 14).

29
Tetralogy of Fallot. (A) Normal four-chamber view. (B) Left ventricular outflow tract with an enlarged aorta that straddles the ventricular septal defect (VSD). (C) Rotated left ventricular outflow tract (see Figure 14) demonstrating the aortic arch (*), enlarged aorta, short-axis view of the right pulmonary artery (RPA), and the ventricular septal defect. (D) Right outflow tract three-vessel view demonstrating a short-axis view of the enlarged aorta, and small pulmonary artery with a bifurcation.
14
Tetralogy of Fallot
- Is the pulmonary artery smaller than the aorta when examining the three-vessel view? If the pulmonary artery appears to be smaller, one should suspect pulmonary underdevelopment associated with tetralogy of Fallot or other pulmonary artery abnormalities such as stenosis (Figure 29D, Video 14).
- Does the aortic arch appear to be normal by imaging the ascending aorta, transverse arch and descending aorta? If the vessel bifurcates immediately after exiting the LV, this is a classic sign of D-transposition of the great arteries (Figure 30).

30
D-transposition of the great arteries. (A) Four-chamber view. (B) Left outflow tract view demonstrating bifurcation of the main pulmonary artery as it exits the left ventricle (LV). (C) Right outflow tract view demonstrating the aorta originating from the right ventricle. AV, aortic valve; LA, left atrium; LPA, left pulmonary artery; MPA, main pulmonary artery; RA, right atrium; RPA, right pulmonary artery; RV, right ventricle; SVC, superior vena cava; T, trachea.
- Does the 3VTV converge as the vessels enter the aorta or are they separated? If the vessels are separated by the trachea, which lies between the vessels, this is associated with a right-sided aortic arch or other arch anomalies (Figure 31).

31
Right-sided aortic arch. (A) Four-chamber view. (B) Left outflow tract view. (C) Right outflow tract view. (D) Three-vessel-and-trachea view demonstrating parallel ductus arteriosus and transverse aortic arch with the trachea separating the two vessels.
CONCLUSION
This review has attempted to provide a guide as to how the examiner could approach the screening examination of the fetal heart. Instead of listing different malformations, the anatomical features of the screening examination have been reviewed and questions posed about the anatomical structures that would provide clues that a malformation could be present. Video 15 is a summary of the “enhancements” recently suggested for the ISUOG screening guidelines.15
15
Summary of enhancements to the ISUOG screening examination15.
PRACTICE RECOMMENDATIONS
- It is important to perform a comprehensive screening examination for fetal heart defects during the second and third trimesters of pregnancy.
- A transverse sweep through the upper abdomen and chest to identify key anatomical features such as the fetal stomach, four-chamber view (4CV), left and right ventricular outflow tracts (LVOT and RVOT), and the three-vessel-and-trachea view (3VTV) should be performed, as recommended in ISUOG’s screening guidelines.
- The guidelines suggest assessing the position and axis of the heart within the chest, determining the situs, and evaluating the heart's size and the outflow tracts to effectively identify any structural abnormalities.
- The use of both color and power Doppler imaging is recommended to enhance the detection of any shunting ventricular defects or valve regurgitations that may not be apparent on two-dimensional grayscale ultrasound.
- Screening aims to identify fetuses at risk for congenital heart defects early enough to allow for detailed echocardiography and appropriate management planning.
CONFLICTS OF INTEREST
The author(s) of this chapter declare that they have no interests that conflict with the contents of the chapter.
Feedback
Publishers’ note: We are constantly trying to update and enhance chapters in this Series. So if you have any constructive comments about this chapter please provide them to us by selecting the "Your Feedback" link in the left-hand column.
REFERENCES
Parker DM, Stabler ME, MacKenzie TA, Zimmerman MS, Shi X, Everett AD, Bucholz EM, Brown JR. Population-Based Estimates of the Prevalence of Children With Congenital Heart Disease and Associated Comorbidities in the United States. Circ Cardiovasc Qual Outcomes. 2024:e010657. Epub 20240826. doi: 10.1161/circoutcomes.123.010657. PubMed PMID: 39185543. | |
Stallings EB, Isenburg JL, Rutkowski RE, Kirby RS, Nembhard WN, Sandidge T, Villavicencio S, Nguyen HH, McMahon DM, Nestoridi E, Pabst LJ. National population-based estimates for major birth defects, 2016–2020. Birth Defects Res. 2024;116(1):e2301. doi: 10.1002/bdr2.2301. PubMed PMID: 38277408; PMCID: PMC10898112. | |
Lempinen J, Koskimies-Virta E, Kauppala T, Malm H, Gissler M, Kiuru-Kuhlefelt S, Ritvanen A, Leinonen MK. Epidemiology of neural tube defects in Finland: a nationwide register study 1987–2018. Int J Epidemiol. 2024;53(4). doi: 10.1093/ije/dyae092. PubMed PMID: 38981140. | |
DeVore GR. The prenatal diagnosis of congenital heart disease–a practical approach for the fetal sonographer. J Clin Ultrasound. 1985;13(4):229–245. doi: 10.1002/jcu.1870130403. PubMed PMID: 3923046. | |
Copel JA, Pilu G, Green J, Hobbins JC, Kleinman CS. Fetal echocardiographic screening for congenital heart disease: the importance of the four-chamber view. Am J Obstet Gynecol. 1987;157(3):648–655. doi: 10.1016/s0002-9378(87)80022-4. PubMed PMID: 3631166. | |
DeVore GR. The aortic and pulmonary outflow tract screening examination in the human fetus. J Ultrasound Med. 1992;11(7):345–348. doi: 10.7863/jum.1992.11.7.345. PubMed PMID: 1522624. | |
AIUM Practice Parameter for the Performance of Standard Diagnostic Obstetric Ultrasound. J Ultrasound Med. 2024;43(6):E20-E32. Epub 20240115. doi: 10.1002/jum.16406. PubMed PMID: 38224490. | |
Freud LR, Simpson LL. Fetal cardiac screening: 1st trimester and beyond. Prenat Diagn. 2024;44(6–7):679–687. Epub 20240412. doi: 10.1002/pd.6571. PubMed PMID: 38613152. | |
Helmbæk ME, Sundberg K, Jørgensen DS, Petersen OB, Tolsgaard M, Vejlstrup NG, Harmsen L, Kruse C, Steensberg J, Vedel C, Ekelund CK. Clinical implementation of first trimester screening for congenital heart defects. Prenat Diagn. 2024;44(6–7):688–697. Epub 20240513. doi: 10.1002/pd.6584. PubMed PMID: 38738737. | |
Carvalho JS, Axt-Fliedner R, Chaoui R, Copel JA, Cuneo BF, Goff D, Gordin Kopylov L, Hecher K, Lee W, Moon-Grady AJ, Mousa HA, Munoz H, Paladini D, Prefumo F, Quarello E, Rychik J, Tutschek B, Wiechec M, Yagel S. ISUOG Practice Guidelines (updated): fetal cardiac screening. Ultrasound Obstet Gynecol. 2023;61(6):788–803. doi: 10.1002/uog.26224. PubMed PMID: 37267096. | |
Comstock CH. Normal fetal heart axis and position. Obstet Gynecol. 1987;70(2):255–259. PubMed PMID: 3299186. | |
Comstock CH, Smith R, Lee W, Kirk JS. Right fetal cardiac axis: clinical significance and associated findings. Obstet Gynecol. 1998;91(4):495–499. doi: 10.1016/s0029-7844(98)00018-0. PubMed PMID: 9540929. | |
Sompagdee N, Anuwutnavin S, Burapasikarin C, Ruangvutilert P, Thongkloung P. Nomograms of fetal cardiothoracic ratio from 17 to 37 weeks' gestation as assessed by three different measurement techniques and their correlation with gestational age. Prenat Diagn. 2021;41(13):1658–1667. Epub 20211019. doi: 10.1002/pd.6057. PubMed PMID: 34647342. | |
Khalil A, Sotiriadis A, D'Antonio F, Da Silva Costa F, Odibo A, Prefumo F, Papageorghiou AT, Salomon LJ. ISUOG Practice Guidelines: performance of third-trimester obstetric ultrasound scan. Ultrasound Obstet Gynecol. 2024;63(1):131–147. doi: 10.1002/uog.27538. PubMed PMID: 38166001. | |
DeVore GR. Enhancement of the screening examination of the fetal heart as proposed by ISUOG Practice Guidelines. Ultrasound Obstet Gynecol. 2024;63(1):119–122. doi: 10.1002/uog.27479. PubMed PMID: 37724602. | |
DeVore GR. Enhancement of evaluation of the fetal heart as proposed by ISUOG for third trimester ultrasound examination. Ultrasound Obstet Gynecol. 2024 Apr 17. doi: 10.1002/uog.27660. Epub ahead of print. PMID: 38629646. | |
DeVore GR, Satou G, Sklansky M. Area of the fetal heart's four-chamber view: a practical screening tool to improve detection of cardiac abnormalities in a low-risk population. Prenat Diagn. 2017;37(2):151–155. Epub 20170124. doi: 10.1002/pd.4980. PubMed PMID: 27943393. | |
DeVore GR, Tabsh K, Polanco B, Satou G, Sklansky M. Fetal Heart Size: A Comparison Between the Point-to-Point Trace and Automated Ellipse Methods Between 20 and 40 Weeks' Gestation. J Ultrasound Med. 2016;35(12):2543–2562. Epub 20161013. doi: 10.7863/ultra.16.02019. PubMed PMID: 27738291. | |
DeVore GR, Medearis AL, Bear MB, Horenstein J, Platt LD. Fetal echocardiography: factors that influence imaging of the fetal heart during the second trimester of pregnancy. J Ultrasound Med. 1993;12(11):659–663. doi: 10.7863/jum.1993.12.11.659. PubMed PMID: 8264018. | |
DeVore GR, Klas B, Satou G, Sklansky M. Measuring the Area of the Interventricular Septum in the 4-Chamber View: A New Technique to Evaluate the Fetus at Risk for Septal Hypertrophy. J Ultrasound Med. 2022;41(12):2939–2953. Epub 20220319. doi: 10.1002/jum.15980. PubMed PMID: 35305032. | |
DeVore GR, Klas B, Satou G, Sklansky M. Speckle Tracking Analysis to Evaluate the Size, Shape, and Function of the Atrial Chambers in Normal Fetuses at 20-40 Weeks of Gestation. J Ultrasound Med. 2022 Aug;41(8):2041-2057. doi: 10.1002/jum.15888. Epub 2021 Nov 26. PMID: 34825711. | |
DeVore GR. Trisomy 21: 91% detection rate using second-trimester ultrasound markers. Ultrasound Obstet Gynecol. 2000;16(2):133–141. doi: 10.1046/j.1469-0705.2000.00203.x. PubMed PMID: 11117082. | |
Devore GR. Genetic sonography: the historical and clinical role of fetal echocardiography. Ultrasound Obstet Gynecol. 2010;35(5):509–521. doi: 10.1002/uog.7652. PubMed PMID: 20443195. | |
Dizon-Townson DS, Dildy GA, Clark SL. A prospective evaluation of fetal pericardial fluid in 506 second-trimester low-risk pregnancies. Obstet Gynecol. 1997;90(6):958–961. doi: 10.1016/s0029-7844(97)00474-2. PubMed PMID: 9397111. | |
DeVore GR, Cuneo B, Sklansky M, Satou G. Abnormalities of the Width of the Four-Chamber View and the Area, Length, and Width of the Ventricles to Identify Fetuses at High-Risk for D-Transposition of the Great Arteries and Tetralogy of Fallot. J Ultrasound Med. 2023;42(3):637–646. Epub 20220713. doi: 10.1002/jum.16060. PubMed PMID: 35822424. |
Online Study Assessment Option
All readers who are qualified doctors or allied medical professionals can automatically receive 2 Continuing Professional Development points plus a Study Completion Certificate from GLOWM for successfully answering four multiple-choice questions (randomly selected) based on the study of this chapter. Medical students can receive the Study Completion Certificate only.
(To find out more about the Continuing Professional Development awards programme CLICK HERE)