MRI Atlas
Normal
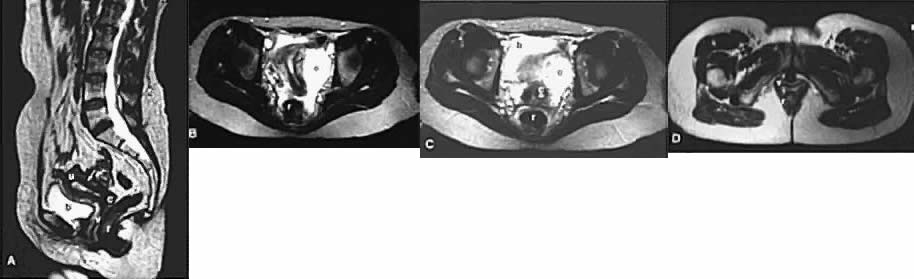 Fig. 1. T2-weighted MRI of a normal female pelvis. A. Sagittal view of the uterine body, cervix, and vagina.
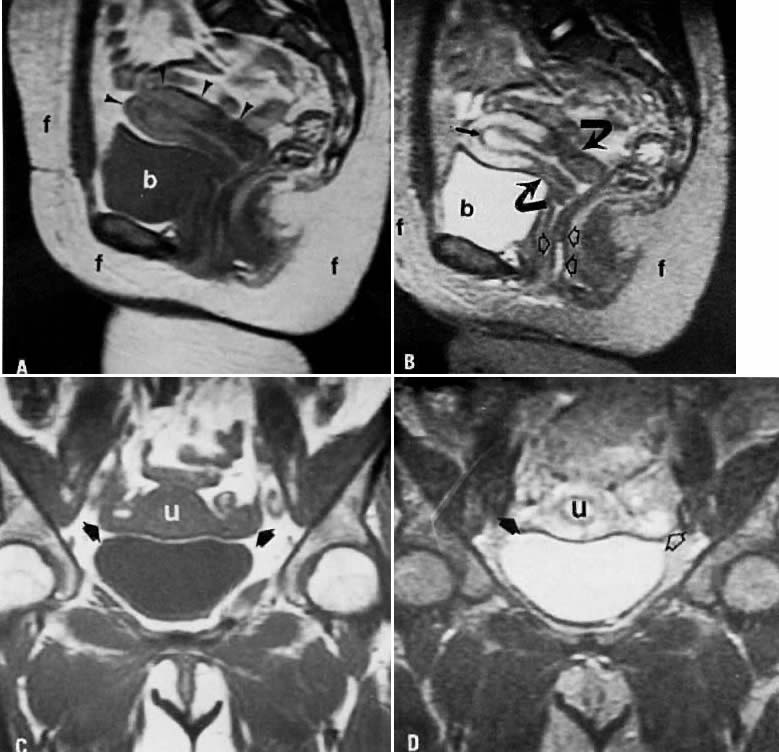 Fig. 3. A. Normal pelvis. Sagittal T1-weighted image of the uterus ( arrowheads ). Note the lack of clear demarcation between the endometrial tissue and
the myometrium. On this T1-weighted image, the bladder fluid (b) has
decreased signal, whereas the fat (f) has high signal. B. Sagittal T2-weighted image obtained at the same location as in A. Three zones are now apparent in the uterus. The area of decreased signal ( arrow) between the myometrium and endometrium is called the junctional zone. The cervix ( curved arrows) has less signal than the uterine fundus. The vagina is readily apparent
as a thin stripe of high signal intensity surrounded by linear bands
of decreased signal intensity ( open arrows ). On this T2-weighted image, the fluid in the bladder (b) now has high
signal intensity, whereas fat (f) has somewhat less signal and is gray. C. Coronal T1-weighted image showing the uterus (u) and adnexa ( arrows ). D. Coronal T2-weighted image at the same level as in C. The internal architecture of the uterus is now well depicted. The right
adnexa ( arrow) is isointense with fat. The left ovary ( open arrow) has slightly increased signal intensity when compared with fat as a result
of several small follicular cysts.
Fig. 3. A. Normal pelvis. Sagittal T1-weighted image of the uterus ( arrowheads ). Note the lack of clear demarcation between the endometrial tissue and
the myometrium. On this T1-weighted image, the bladder fluid (b) has
decreased signal, whereas the fat (f) has high signal. B. Sagittal T2-weighted image obtained at the same location as in A. Three zones are now apparent in the uterus. The area of decreased signal ( arrow) between the myometrium and endometrium is called the junctional zone. The cervix ( curved arrows) has less signal than the uterine fundus. The vagina is readily apparent
as a thin stripe of high signal intensity surrounded by linear bands
of decreased signal intensity ( open arrows ). On this T2-weighted image, the fluid in the bladder (b) now has high
signal intensity, whereas fat (f) has somewhat less signal and is gray. C. Coronal T1-weighted image showing the uterus (u) and adnexa ( arrows ). D. Coronal T2-weighted image at the same level as in C. The internal architecture of the uterus is now well depicted. The right
adnexa ( arrow) is isointense with fat. The left ovary ( open arrow) has slightly increased signal intensity when compared with fat as a result
of several small follicular cysts.
Back to Top
Leiomyomas
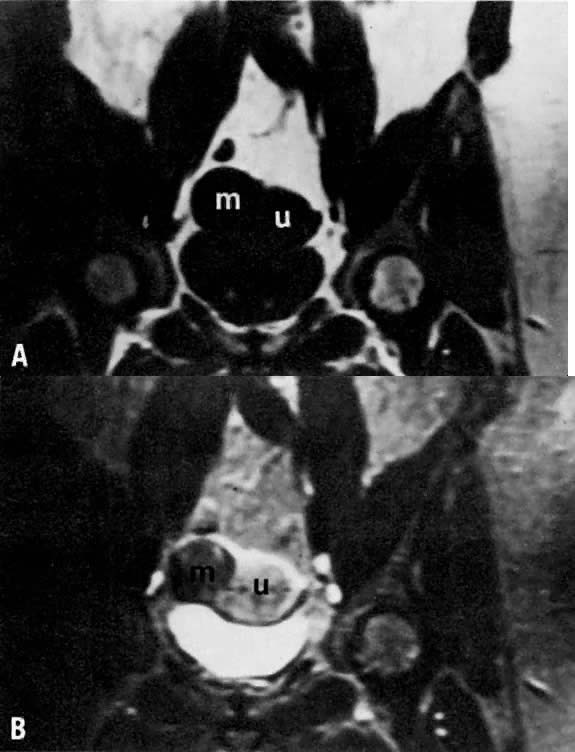 Fig. 4. A. Leiomyoma. Coronal T1-weighted image of an 81-year-old woman with a pelvic
mass. On both clinical examination and ultrasonography, distinction
between an ovarian and uterine mass could not be made. On this sequence, both
the leiomyoma ( m) and uterus ( u) have approximately the same signal intensity. B. T2-weighted image shows the leiomyoma ( m) to have decreased signal intensity when compared with the uterus ( u ).
Fig. 4. A. Leiomyoma. Coronal T1-weighted image of an 81-year-old woman with a pelvic
mass. On both clinical examination and ultrasonography, distinction
between an ovarian and uterine mass could not be made. On this sequence, both
the leiomyoma ( m) and uterus ( u) have approximately the same signal intensity. B. T2-weighted image shows the leiomyoma ( m) to have decreased signal intensity when compared with the uterus ( u ).
Back to Top
Adenomyosis
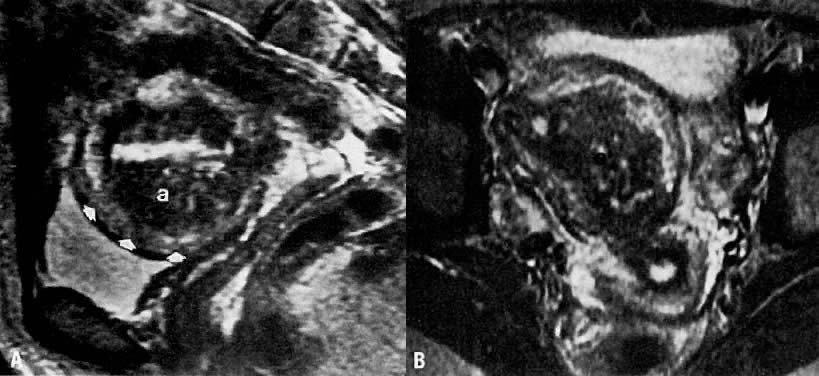 Fig. 5. A. Adenomyosis. Sagittal T2-weighted image of adenomyosis ( a) seen as an irregular, hypoin-tense, enlarged junctional zone with indistinct
margins infiltrating into the myometrium ( arrowheads ). B. Transverse T2-weighted image of the same patient showing adenomyosis ( a ). ( A and B courtesy of Dr. Leslie Scoutt, Yale University)
Fig. 5. A. Adenomyosis. Sagittal T2-weighted image of adenomyosis ( a) seen as an irregular, hypoin-tense, enlarged junctional zone with indistinct
margins infiltrating into the myometrium ( arrowheads ). B. Transverse T2-weighted image of the same patient showing adenomyosis ( a ). ( A and B courtesy of Dr. Leslie Scoutt, Yale University)
Back to Top
Hemorrhagic Ovarian Cyst
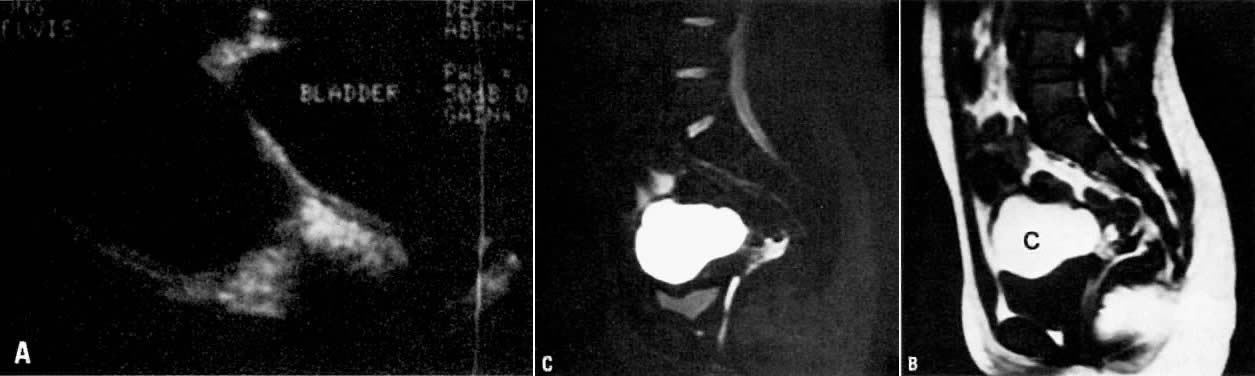 Fig. 11. A. Hemorrhagic cyst. Longitudinal view of the pelvis on ultrasonography showing
a large fluid-filled mass in the pelvis. B. Sagittal T1-weighted image showing a mass with high signal intensity superior
to the bladder (c). C. T2-weighted sagittal image showing the cyst to have persistently high
signal intensity. Findings are consistent with a hemorrhagic cyst subsequently
confirmed at surgery.
Fig. 11. A. Hemorrhagic cyst. Longitudinal view of the pelvis on ultrasonography showing
a large fluid-filled mass in the pelvis. B. Sagittal T1-weighted image showing a mass with high signal intensity superior
to the bladder (c). C. T2-weighted sagittal image showing the cyst to have persistently high
signal intensity. Findings are consistent with a hemorrhagic cyst subsequently
confirmed at surgery.
Back to Top
Endometrioma
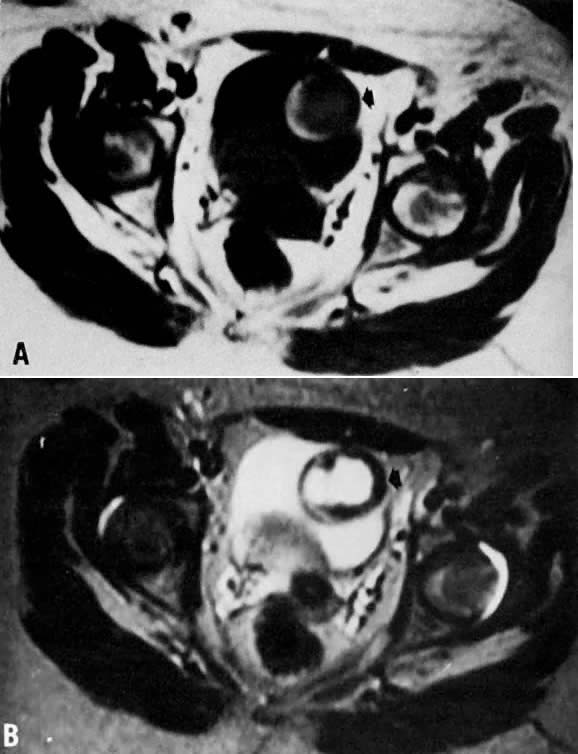 Fig. 12. A. Endometrioma. Transverse T1-weighted image showing a left adnexal mass
with areas of both increased and decreased signal ( arrow ). B. T2-weighted image showing change in signal intensities within the cyst
consistent with different stages of blood. Findings are consistent with
the final diagnosis of an endometrioma.
Fig. 12. A. Endometrioma. Transverse T1-weighted image showing a left adnexal mass
with areas of both increased and decreased signal ( arrow ). B. T2-weighted image showing change in signal intensities within the cyst
consistent with different stages of blood. Findings are consistent with
the final diagnosis of an endometrioma.
Back to Top
Dermoid
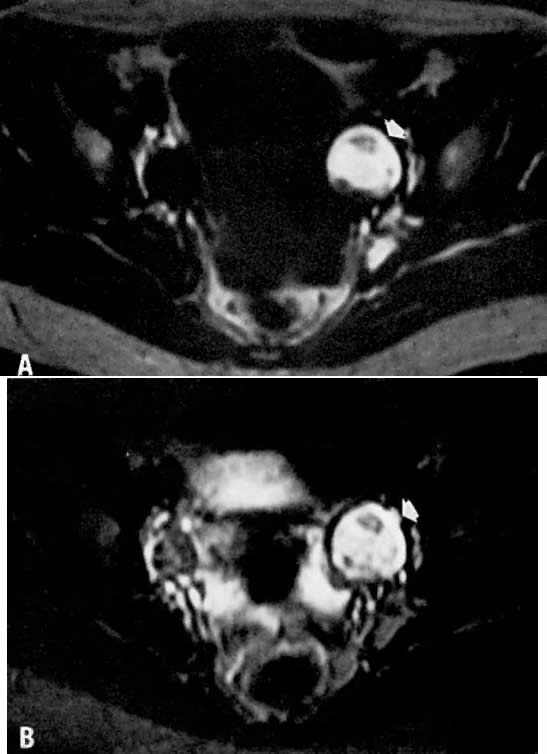 Fig. 13. A. Dermoid. T1-weighted transverse image showing a left adnexal cyst of high
signal intensity ( arrow ). B. With increased T2 weighting, the cyst shows persistently high signal intensity. Findings
are consistent with the diagnosis of a dermoid.
Volume 1,
Chapter 93
Fig. 13. A. Dermoid. T1-weighted transverse image showing a left adnexal cyst of high
signal intensity ( arrow ). B. With increased T2 weighting, the cyst shows persistently high signal intensity. Findings
are consistent with the diagnosis of a dermoid.
Volume 1,
Chapter 93
Back to Top
Simple Ovarian Cyst
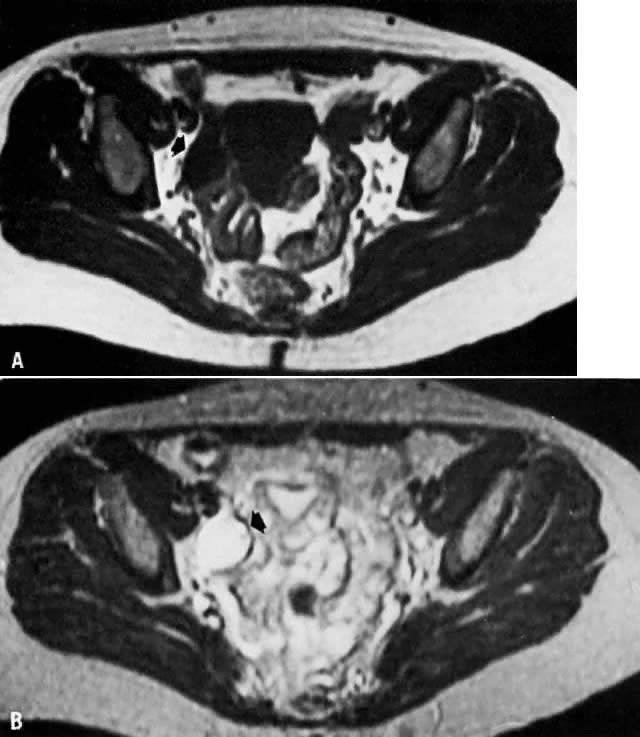 Fig. 14. A. Simple ovarian cyst. Transverse T1-weighted image showing a right adnexal
soft-tissue density of low signal intensity ( arrow ). B. With increased T2 weighting, the abnormality shows high signal intensity. The
thin wall and the appearance on both T1- and T2-weighted images
are consistent with the final diagnosis of a simple ovarian cyst.
Fig. 14. A. Simple ovarian cyst. Transverse T1-weighted image showing a right adnexal
soft-tissue density of low signal intensity ( arrow ). B. With increased T2 weighting, the abnormality shows high signal intensity. The
thin wall and the appearance on both T1- and T2-weighted images
are consistent with the final diagnosis of a simple ovarian cyst.
Back to Top
Uterine Prolapse
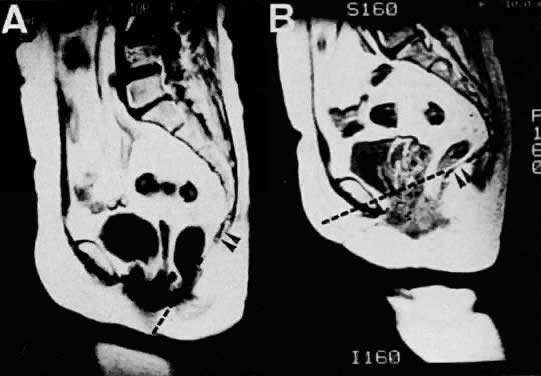 Fig. 15. Sagittal MR images of a 62-year-old patient with uterine prolapse before
corrective surgery (A) and after surgery (B). Note that the levator plate is highlighted by the dashed line and does not cross the symphysis prior to surgery but clearly crosses
the symphysis after surgery.(Ozasa H, Mori T, Togashi K: Study of uterine prolapse by magnetic resonance
imaging: Topographical changes involving the levator ani muscle
and the vagina. Gynecol Obstet Invest 34:43, 1992)
Volume 1,
Chapter 93
Fig. 15. Sagittal MR images of a 62-year-old patient with uterine prolapse before
corrective surgery (A) and after surgery (B). Note that the levator plate is highlighted by the dashed line and does not cross the symphysis prior to surgery but clearly crosses
the symphysis after surgery.(Ozasa H, Mori T, Togashi K: Study of uterine prolapse by magnetic resonance
imaging: Topographical changes involving the levator ani muscle
and the vagina. Gynecol Obstet Invest 34:43, 1992)
Volume 1,
Chapter 93
Back to Top
Hydrometra
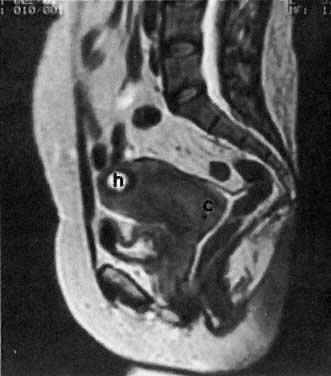 Fig. 7. T2-weighted sagittal MRI of the pelvis shows cervical carcinoma ( c) causing hydrometras ( h ).
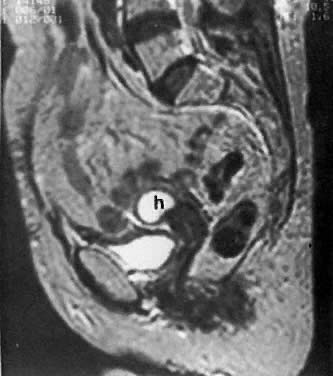 Fig. 10. Sagittal T2-weighted MRI of the pelvis shows moderate hydrometras ( h) caused by postirradiation cervical scarring.
Back to Top
Post-irradiation Fibrosis
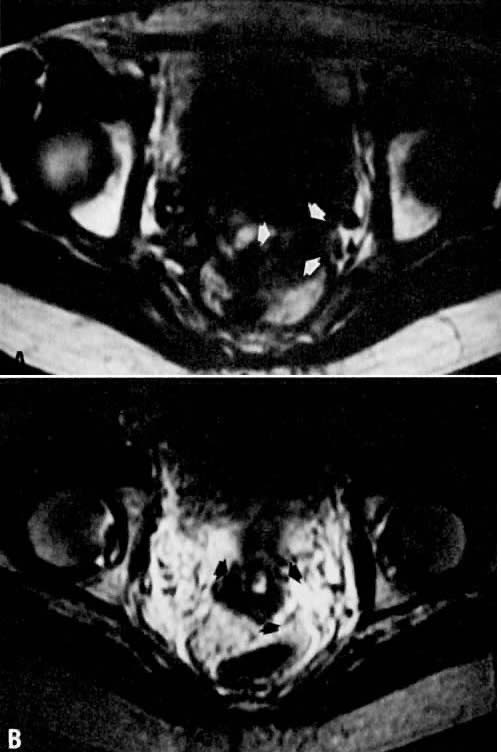 Fig. 10. A. Fibrosis. Transverse T1-weighted image showing minimal fullness in the
tissues surrounding the cervix ( arrows ). B. With T2 weighting, the tissues surrounding the cervix show no increase
in signal, suggesting radiation-induced fibrosis. Biopsy specimens failed
to identify persistent disease.
Fig. 10. A. Fibrosis. Transverse T1-weighted image showing minimal fullness in the
tissues surrounding the cervix ( arrows ). B. With T2 weighting, the tissues surrounding the cervix show no increase
in signal, suggesting radiation-induced fibrosis. Biopsy specimens failed
to identify persistent disease.
Back to Top
Endometrial Cancer
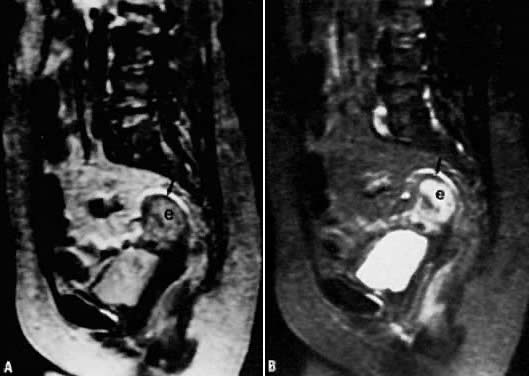 Fig. 6. A. Endometrial carcinoma. Slightly T2-weighted sagittal image in a patient
with endometrial carcinoma (e). Normal zonal anatomy has been disrupted. The
central region of high signal intensity represents endometrial
carcinoma that has invaded through the junctional zone and extends deeply
into the myometrium. Only a small rim of normal myometrium remains ( arrow ). B. A more T2-weighted image than in A, showing similar findings.
Fig. 6. A. Endometrial carcinoma. Slightly T2-weighted sagittal image in a patient
with endometrial carcinoma (e). Normal zonal anatomy has been disrupted. The
central region of high signal intensity represents endometrial
carcinoma that has invaded through the junctional zone and extends deeply
into the myometrium. Only a small rim of normal myometrium remains ( arrow ). B. A more T2-weighted image than in A, showing similar findings.
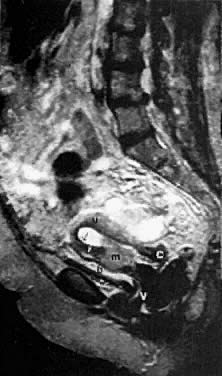 Fig. 22. Sagittal T2-weighted MRI in a patient with a stage IA endometrial carcinoma
shows replacement of the lower two thirds of the hyperintense endometrium
by an inhomogeneous medium-intensity irregular mass ( m) that invades the deeper layer of the myometrium anteriorly. ( u, uterus; c, cervix; v, vagina; b, bladder; black arrow, endometrium; white arrow, uterine junctional zone.)
Fig. 22. Sagittal T2-weighted MRI in a patient with a stage IA endometrial carcinoma
shows replacement of the lower two thirds of the hyperintense endometrium
by an inhomogeneous medium-intensity irregular mass ( m) that invades the deeper layer of the myometrium anteriorly. ( u, uterus; c, cervix; v, vagina; b, bladder; black arrow, endometrium; white arrow, uterine junctional zone.)
Back to Top
Cervical Cancer
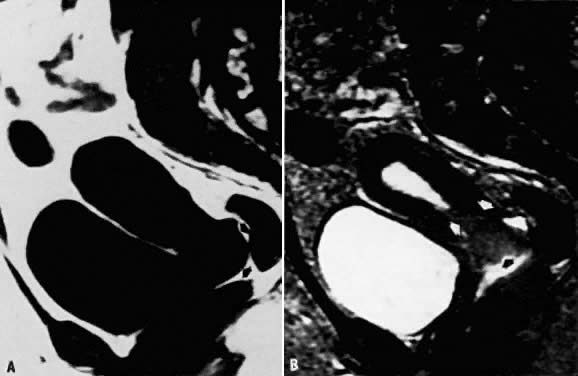 Fig. 7. A. Cervical carcinoma. Sagittal T1-weighted image showing prominence in the
region of the cervix. Distinction between the vagina, cervix, and a
soft-tissue mass is difficult ( arrows ). B. Sagittal T2-weighted image in the same location. The cervical carcinoma
can now be seen extending toward the fundus as well as into the vaginal
vault ( arrows ).
Fig. 7. A. Cervical carcinoma. Sagittal T1-weighted image showing prominence in the
region of the cervix. Distinction between the vagina, cervix, and a
soft-tissue mass is difficult ( arrows ). B. Sagittal T2-weighted image in the same location. The cervical carcinoma
can now be seen extending toward the fundus as well as into the vaginal
vault ( arrows ).
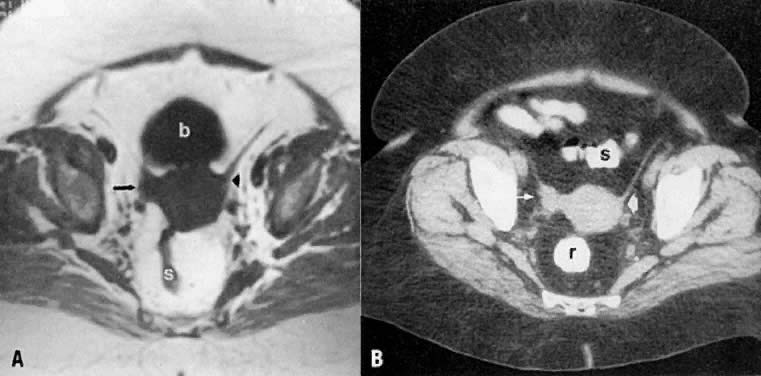 Fig. 2. Axial T1-weighted MR ( A) and CT ( B) images of the pelvis in a patient with cervical cancer show right parametrial
extension of tumor ( arrow ). Note the normal left parametrium ( arrowhead ). Proven stage IIB. ( s, sigmoid; b, bladder; r, rectum.)
Fig. 2. Axial T1-weighted MR ( A) and CT ( B) images of the pelvis in a patient with cervical cancer show right parametrial
extension of tumor ( arrow ). Note the normal left parametrium ( arrowhead ). Proven stage IIB. ( s, sigmoid; b, bladder; r, rectum.)
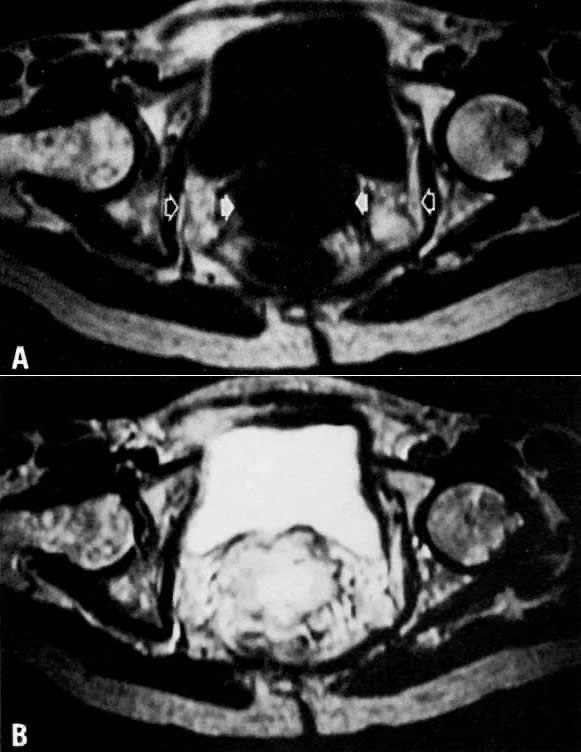 Fig. 8. A. Parametrial extension. Transverse T1-weighted image of a patient with
cervical carcinoma extending into the parametrium ( white arrows ). The pelvic side walls ( open arrows) are uninvolved. B. T2-weighted image showing the cancer to have high signal intensity.
Fig. 8. A. Parametrial extension. Transverse T1-weighted image of a patient with
cervical carcinoma extending into the parametrium ( white arrows ). The pelvic side walls ( open arrows) are uninvolved. B. T2-weighted image showing the cancer to have high signal intensity.
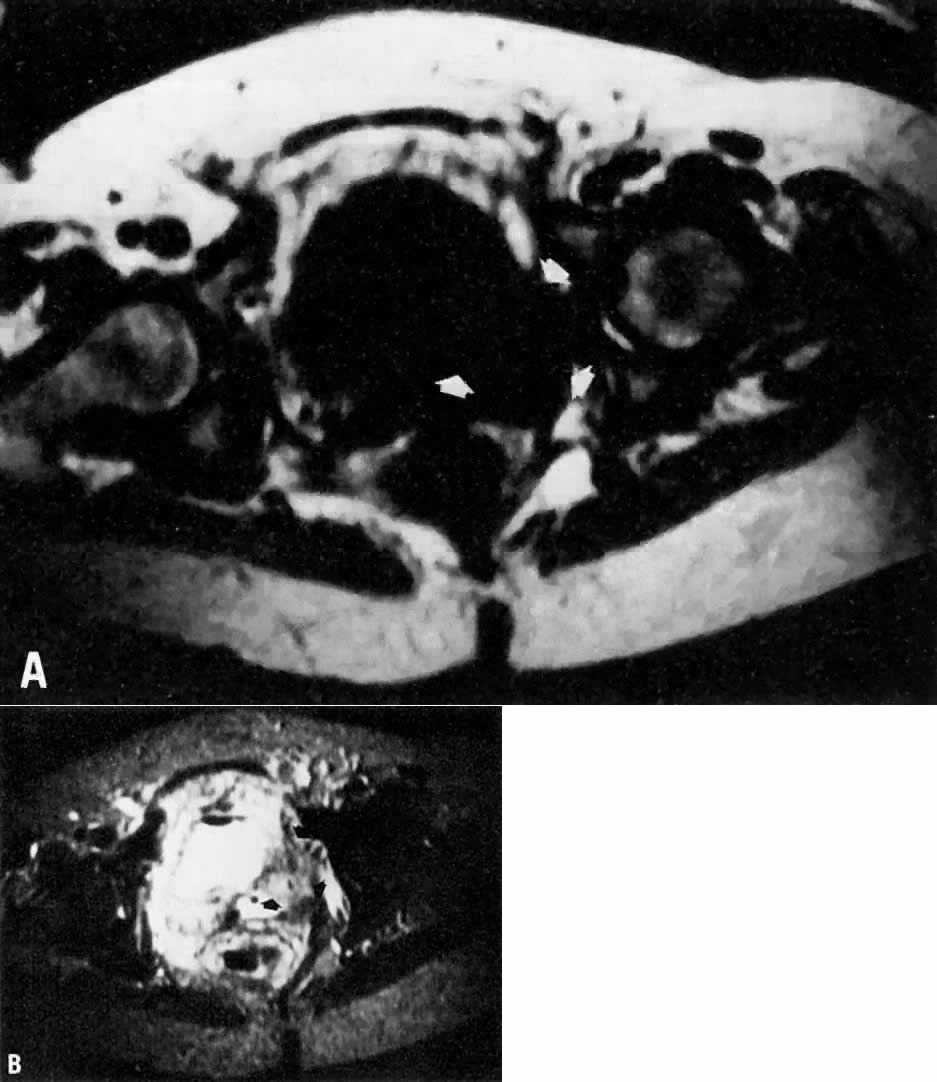 Fig. 9. A. Recurrent cervical carcinoma. Transverse T1-weighted image through the
pelvis showing a large left pelvic soft-tissue mass ( arrows ). B. With T2 weighting, the mass in A now shows increased signal intensity consistent with recurrent carcinoma.
Fig. 9. A. Recurrent cervical carcinoma. Transverse T1-weighted image through the
pelvis showing a large left pelvic soft-tissue mass ( arrows ). B. With T2 weighting, the mass in A now shows increased signal intensity consistent with recurrent carcinoma.
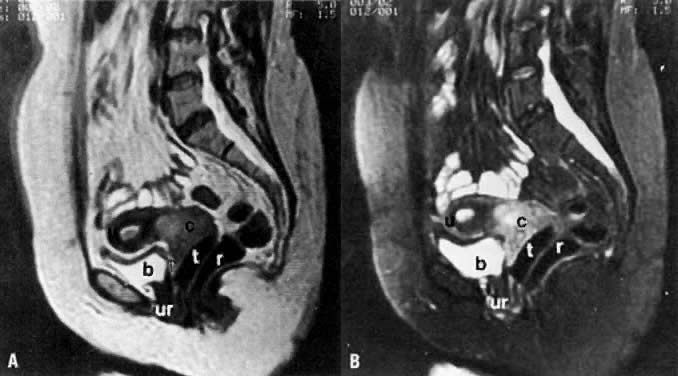 Fig. 14. A. Sagittal T1-weighted MRI of a cervical carcinoma. Note the large, hyperintense
mass enlarging the cervix. A tampon is in place to outline the
vagina. Preservation of the fat planes that separate the cervix from
the bladder and rectum ( arrows) excludes extension to these organs. B. Sagittal T2-weighted fat suppression MRI of the same patient. ( u, uterus; c, cervical carcinoma; b, bladder; r, rectum; ur, urethra; t, tampon.)
Fig. 14. A. Sagittal T1-weighted MRI of a cervical carcinoma. Note the large, hyperintense
mass enlarging the cervix. A tampon is in place to outline the
vagina. Preservation of the fat planes that separate the cervix from
the bladder and rectum ( arrows) excludes extension to these organs. B. Sagittal T2-weighted fat suppression MRI of the same patient. ( u, uterus; c, cervical carcinoma; b, bladder; r, rectum; ur, urethra; t, tampon.)
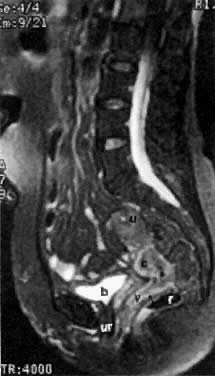 Fig. 15. Sagittal T2-weighted MRI of a stage IIA cervical carcinoma ( c) shows invasion in upper third of the posterior vaginal wall ( arrow ). ( u, uterus; v, vagina; b, bladder; r, rectum; ur, urethra.)
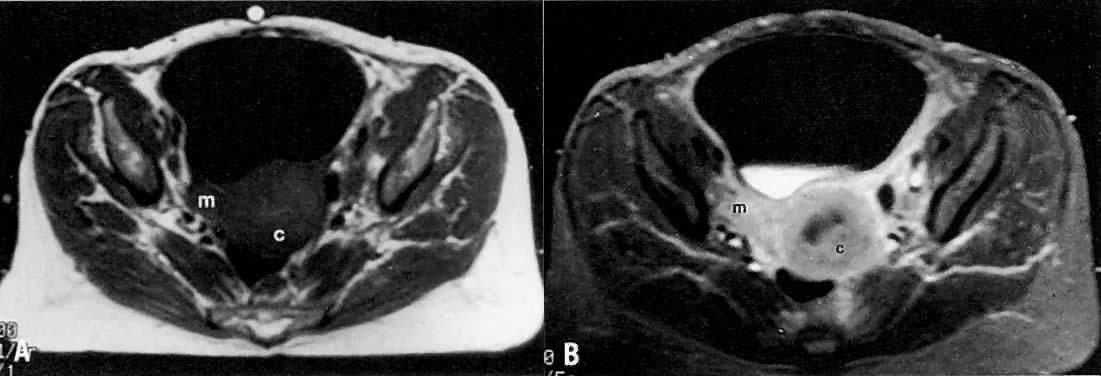 Fig. 16. A. Axial T1-weighted MRI of a stage IIB cervical carcinoma shows a mass ( m) extending from the cervical tumor ( c) in the right parametrium. B. Axial contrast-enhanced T1-weighted MRI shows enhancement of the cervical
and parametrial mass after gadolinium bolus injection.(Mayr NA, Tali ET, Yuh WTC et al: Cervical cancer: Application of MR imaging
in radiation therapy. Radiology 189:601, 1993)
Volume 4,
Chapter 54
Fig. 16. A. Axial T1-weighted MRI of a stage IIB cervical carcinoma shows a mass ( m) extending from the cervical tumor ( c) in the right parametrium. B. Axial contrast-enhanced T1-weighted MRI shows enhancement of the cervical
and parametrial mass after gadolinium bolus injection.(Mayr NA, Tali ET, Yuh WTC et al: Cervical cancer: Application of MR imaging
in radiation therapy. Radiology 189:601, 1993)
Volume 4,
Chapter 54
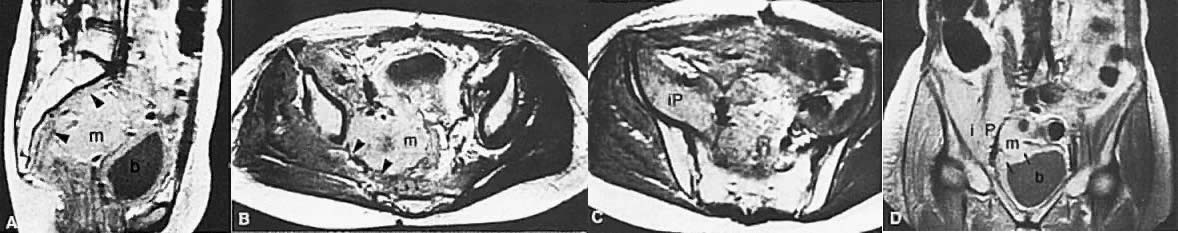 Fig. 17. Recurrent cervical carcinoma with possible radiation changes in the bones
and muscles. Sagittal ( A ), low-transverse ( B ), coronal ( C ), and high-transverse ( D) T1-weighted MRI of the pelvis show a large high-signal-intensity mass ( m) (density less than that of fat and more than that of muscle) superior
and posterior to the bladder ( b ). Note thickening of the right lateral and superior bladder wall caused
by tumor invasion ( arrows ). There is also spread of tumor to the pelvic sidewall ( arrowheads ). There is thickening and increased signal intensity to the right iliopsoas
muscle ( ip) compared to the left. There is also evidence of increased signal intensity
to the bone marrow of the sacrum and L5 in A. The muscle and bone changes are probably caused by radiation.
Fig. 17. Recurrent cervical carcinoma with possible radiation changes in the bones
and muscles. Sagittal ( A ), low-transverse ( B ), coronal ( C ), and high-transverse ( D) T1-weighted MRI of the pelvis show a large high-signal-intensity mass ( m) (density less than that of fat and more than that of muscle) superior
and posterior to the bladder ( b ). Note thickening of the right lateral and superior bladder wall caused
by tumor invasion ( arrows ). There is also spread of tumor to the pelvic sidewall ( arrowheads ). There is thickening and increased signal intensity to the right iliopsoas
muscle ( ip) compared to the left. There is also evidence of increased signal intensity
to the bone marrow of the sacrum and L5 in A. The muscle and bone changes are probably caused by radiation.
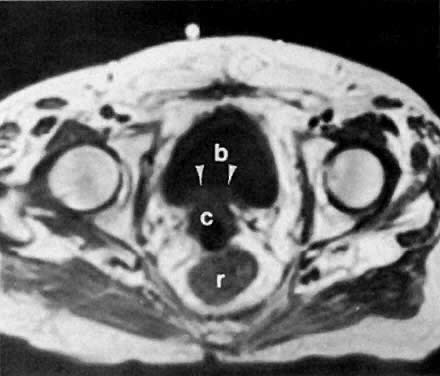 Fig. 18. Axial T1-weighted MRI shows a stage IV cervical carcinoma. Note the focal
thickening of the bladder ( b) base ( arrowheads) caused by direct extension from the cervical mass ( c ). Note also the obliteration of the intervening fat plane. ( r, rectum.)
Fig. 18. Axial T1-weighted MRI shows a stage IV cervical carcinoma. Note the focal
thickening of the bladder ( b) base ( arrowheads) caused by direct extension from the cervical mass ( c ). Note also the obliteration of the intervening fat plane. ( r, rectum.)
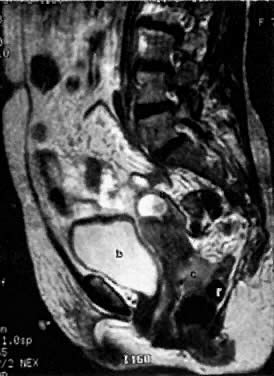 Fig. 19. Sagittal T2-weighted MRI in a patient with stage IVA cervical cancer shows
invasion of the anterior wall of the rectum ( r ). ( u, uterus; c, cervical mass; v, vagina; b, bladder.)
Fig. 19. Sagittal T2-weighted MRI in a patient with stage IVA cervical cancer shows
invasion of the anterior wall of the rectum ( r ). ( u, uterus; c, cervical mass; v, vagina; b, bladder.)
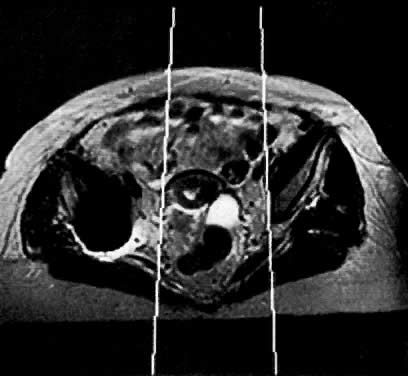 Fig. 57. Axial MRI shows the utility of MR in planning radiation ports. In this
case, MR showed that the tumor extending into the right parametrium is
not included in the radiation port.
Fig. 57. Axial MRI shows the utility of MR in planning radiation ports. In this
case, MR showed that the tumor extending into the right parametrium is
not included in the radiation port.
Back to Top
Ovarian Cancer
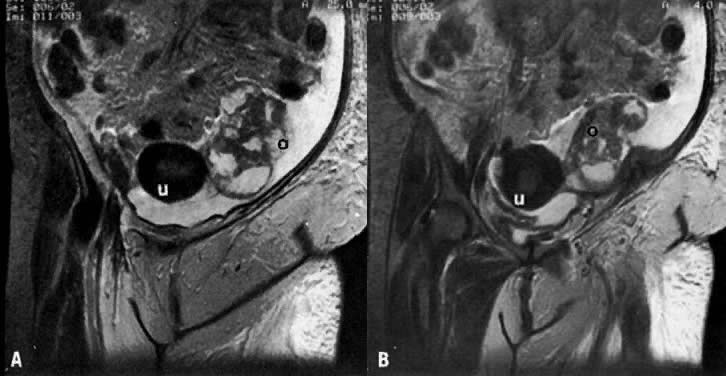 Fig. 32. A and B. Sequential coronal T2-weighted MRI of the pelvis in a patient with left
ovarian carcinoma. Note that the left ovary ( o) is enlarged, lobulated, irregular, and inhomogeneous with areas of high
and medium signal intensities. ( u, uterus.)
Volume 4,
Chapter 54
Fig. 32. A and B. Sequential coronal T2-weighted MRI of the pelvis in a patient with left
ovarian carcinoma. Note that the left ovary ( o) is enlarged, lobulated, irregular, and inhomogeneous with areas of high
and medium signal intensities. ( u, uterus.)
Volume 4,
Chapter 54
Back to Top
Pituitary Microadenoma
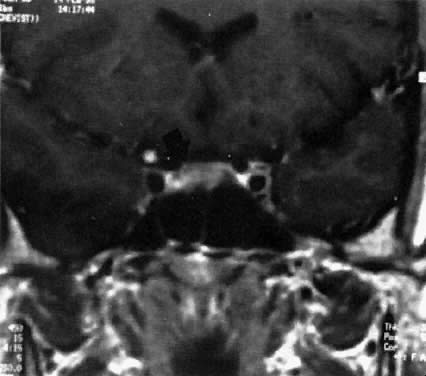 Fig. 1. Magnetic resonance imaging scan of patient with a prolactin-secreting microadenoma ( arrow ).
Back to Top
Pituitary Macroadenoma
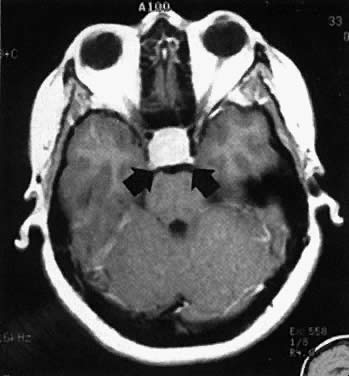 Fig. 2. Magnetic resonance imaging scan of a patient with a prolactin-secreting
macroadenoma ( arrow ).
Fig. 2. Magnetic resonance imaging scan of a patient with a prolactin-secreting
macroadenoma ( arrow ).
Back to Top
|